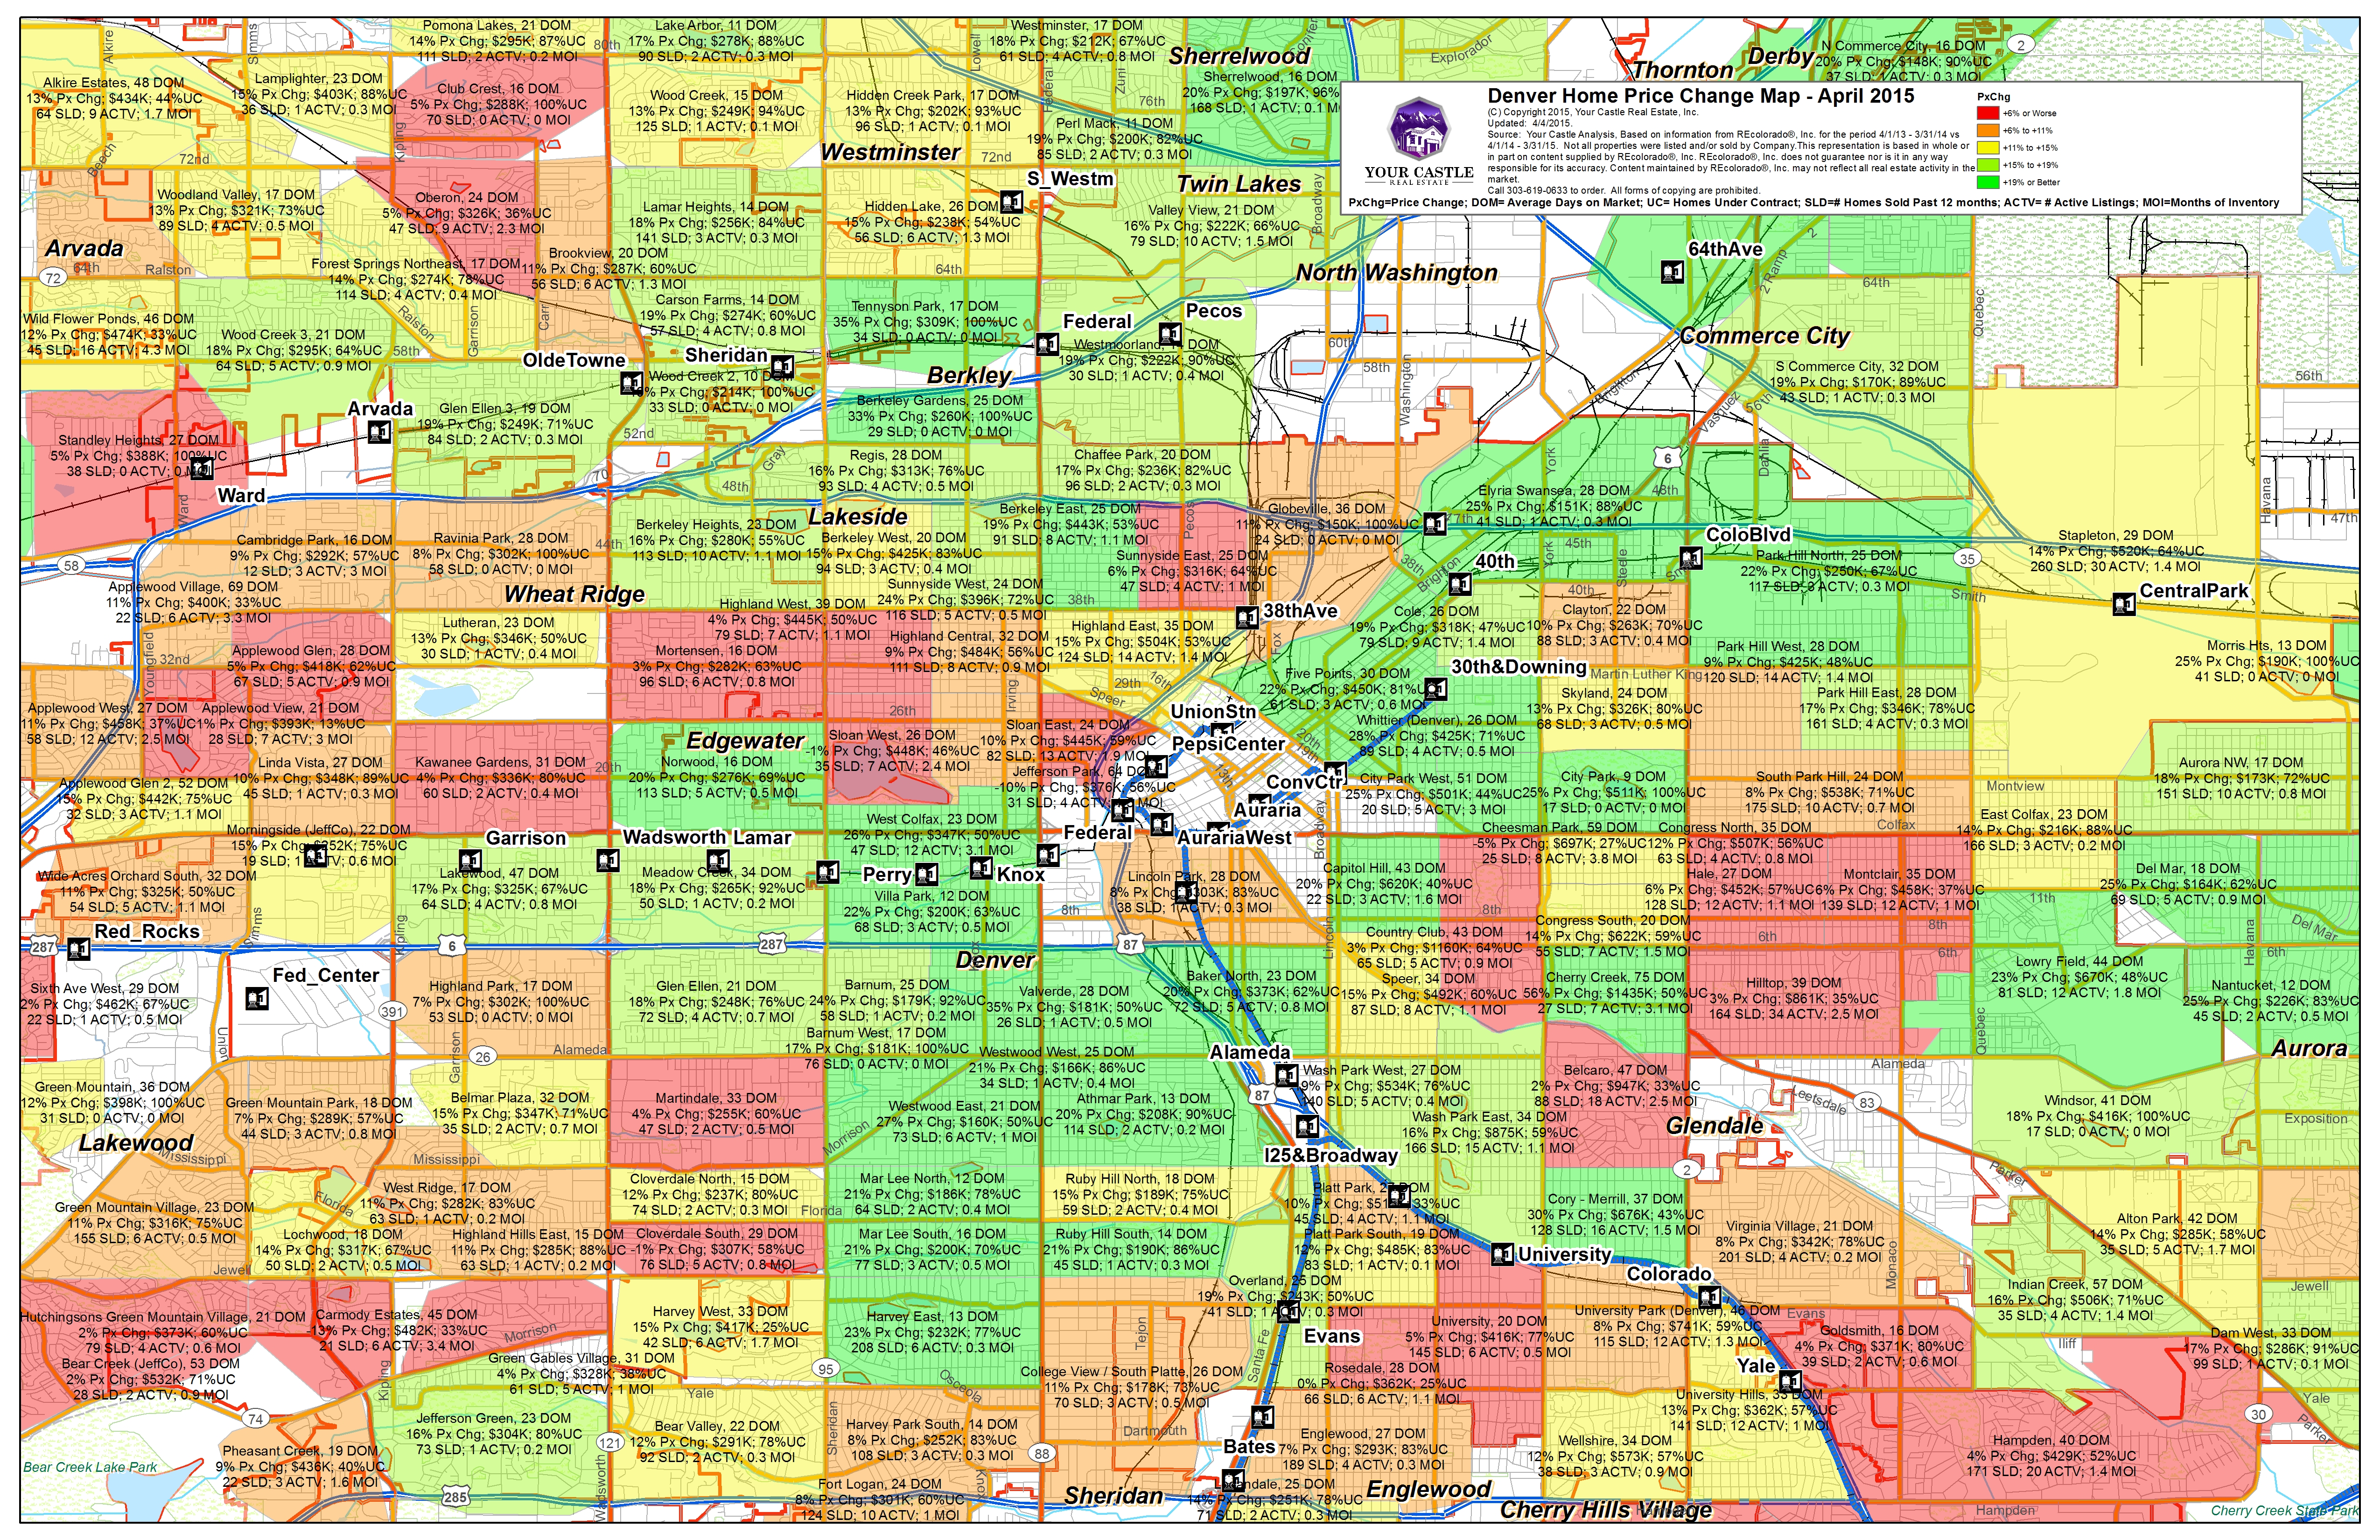
For more information on how to interpret this map and what I think the trends show for the future, just give me a call at 303-506-6786 or shoot me an email at aaron@inhabitdenver.com. Click on image to view at full size and zoom in to see specific neighborhood data.
Key to Abbreviations: PX Chg=% Price Change, DOM=Days on Market, UC=Under Contract, SLD=Number Sold this Quarter, ACTV= Number of homes currently For Sale and not under contract, MOI=Number of Months of Current Inventory based on Current Sale Rates.