I just wrote an email to a client who had basically this question in response to the quarterly price change map and I tend to answer this question in one form or another multiple times a month. So here is a deeper dive response that I gave him.
That is a great question! I think this is a great example of how statistics can be a mixed bag. We all love statistics because it can tell a story in a quick powerful way, but it can also be misleading. The price change map shows how the Average Price of a home sold over the last year in a neighborhood has changed. In general there are some things this can tell us that is meaningful but I think its easy to extrapolate this too far.
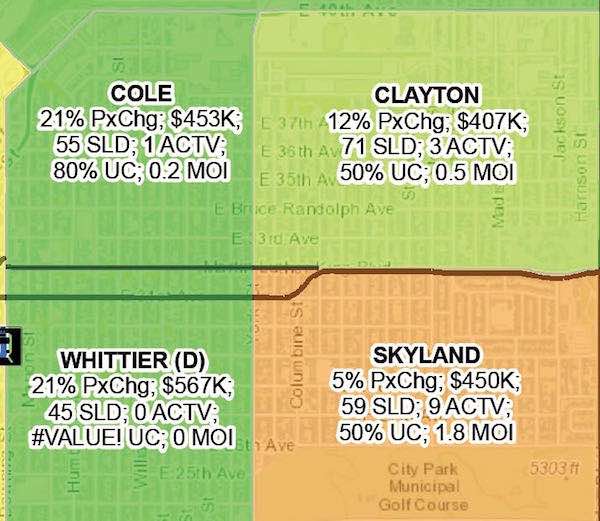
For example, in the Cole neighborhood it shows that the average price of a home in sold in Cole went up 21%. Does this then mean that every house in Cole went up 21%? I don’t think so. It simply means that more expensive homes were sold this year than in the past in relation to the number of cheaper homes. So in Cole, this is interesting because it means that if you are a house flipper or even spec builder this means that you can push the upper limit of what a home can sell for now more than you could have in the past. This also could show that people are scraping and building more expensive homes. So if a neighborhood is all single story homes selling for 300K and people start scraping and building 2-3 story homes selling for 800K+. This will push the average price up. Will the single family homes stay at 300K value as this happens? Maybe, but more likely the value will go up. Here’s what I mean. In a neighborhood like this the value of the single family home will now follow what a builder is willing to pay for that single family home and still make their needed profit if that value is more than what the house would be without the additional redevelopment upside. In this case the value of that single family home is now in the land value.
There are other neighborhoods (West Colfax as an example) where the zoning has changed to higher density housing. (The slot home design is changing so that has an affect too but that will be a separate post). But up till now where there is a single family home you could build 5-6+ slot home (rowhome) units. A builder will pay around 100k per door for the development opportunity. This means that you could have a remodeled 1200 sq. ft. bungalow on a lot like this and a crappy old house infested with termites next door and they are worth the same because the land value is worth 500-600K and that 1200 sq. ft. home would not be worth that without the zoning that allows the development opportunity. This is why the Average price spread between West Colfax and Villa Park (the neighborhood to the south across the light rail) is 239K. West Colfax is closer to Sloans lake, plus there is more development happening there, but a big driver is that for the most part the most dense zoning available in Villa Park is for 2 units (TU). A couple years ago the spread was only 100K. Both neighborhoods have appreciation of 14-16%. The other reason for this is that when these homes get scraped and these 5 units get built they each sell for between 450-550K and a lot of them sell. This influx of more higher dollar sales amounts skews the average up in this neighborhood.
So lets take a look at the opposite end of the spectrum and look at one of the orange or red neighborhoods that show less than the Denver 2017 Average of 10%. The 2017 Q4 price change map shows appreciation was 5% in Wash Park. Really? Wash Park is a great neighborhood and it only appreciated 5%?? Does this mean that every house in Wash Park only appreciated by 5%? Maybe, but I don’t think so. Its a good neighborhood and its been a good neighborhood for a long time. Look at all the red neighborhoods that in Central Denver on the map. For the most part these are the historically good and expensive neighborhoods. Cherry Creek, Congress Park, Country Club, etc. Why would Wash Park show less appreciation than Cole? Like all statistics, there is always more to the story and multiple ways to interpret. Again this is saying the Average Price only went up by 5% right? In general I think that the old saying “don’t buy the best house on the block” in regards to appreciation could play a role here or another saying, “The tide rises all ships” is also true. Let me unpack that a little. When you look at Denver, A city that as a whole that has had a run of 7-8 years of Solid growth and rapidly increasing lack of affordability the neighborhoods that are more affordable have had more demand because people want to live close to downtown but still have a budget and as such bidding wars have been the norm and some of the most rapid increase in prices. Barnum, Athmar Park, Ruby Hill, Regis, Chaffee Park, Cole, Clayton, Globeville, Elyria Swansea, and perfect examples of this. A lot of these neighborhoods had gone through periods where they were a little run down and coupled with lack of city attention and resources they were a little neglected. Enter gentrification, investors, and extremely unbalanced supply and demand and you get increasing prices. Does this sound like Wash Park to you? Nope. Wash Park has always been one of the quintessential “A+” neighborhoods in Denver. Good Architecture, quaint walkable streets, good schools, a world class urban park within walking distance. Wash Park never had a downturn so its growth will be steady with less dramatic swings.
So this is really long winded and really it’s just scratching the surface, but one thing this shows is that really this map is more of a conversation starter than a substitute for a CMA. This map tells a lot of stories that I think are fascinating about what is happening in Denver but if you want to know how much a particular house has gone up in value the only way to know that is to find comparable sales, make adjustments to the comps and make an analysis on the value based on those comps. This is what realtors and appraisers do.
So did your house go up in value by 21%? Maybe, but probably not. If you want to know for sure have us do a Comparative Market Analysis.
Best,
Aaron
303-506-6786