Welcome to the Inhabit Denver Blog
Keep up with all things Real Estate in Denver, Colorado

How to take advantage of Denver’s Hot Market
So Denver’s Market is hot… Sellers are getting more than full price and great terms in bidding wars… That’s great for everybody that happens to need to sell who is relocating out of state to another area where real estate is much less expensive. They are selling high and and buying low by doing that right? But what about the rest of us? What if you don’t want to move to another state? Maybe you want to move up and buy a little bigger house or in a different neighborhood? Do you want a rental? If the answer to any of these questions is “yes” then read on. Scenario 1: You want to sell but don’t want to have to rent while you are looking for your next house to buy? This is probably the Number 1 reason why people don’t sell. This is a reasonable and common fear. The good news is there is a way around this. Two solutions are “Seller Contingencies” and Seller Rent Backs or Post Closing Occupancy. Here’s how it works. Because the Denver market is such an extreme sellers market, sellers have the upper hand in negotiating with buyers. If you have a well maintained house and you price it when comparable sales show it should be priced at you will most likely have at least 5 or 6 offers to choose from.While price is an important part of the offer we also need to look at how qualified the buyer is, their down payment amount and possibly most importantly their terms. By terms I mean what are their dates and deadlines for...
Denver hits #1 for Home Appreciation Rate
According to CoreLogic’s latest Home Price Index, released Tuesday. Home prices in Colorado grew by 9.8 percent in February, the fastest rate of growth anywhere in the country. Denver Metro had an even higher rate of 11.1% but even that pales in comparison to some of the cities neighborhoods that had appreciation rates north of 20%. Nationally the average was 5.6%. To see a what how your neighborhood faired since last year click here for the 2nd Qtr. Price change map. Look for my next series of blog posts on how to take advantage of this hot Denver market creatively and I’m saying you need to sell here and move to Kansas where real estate is cheap…...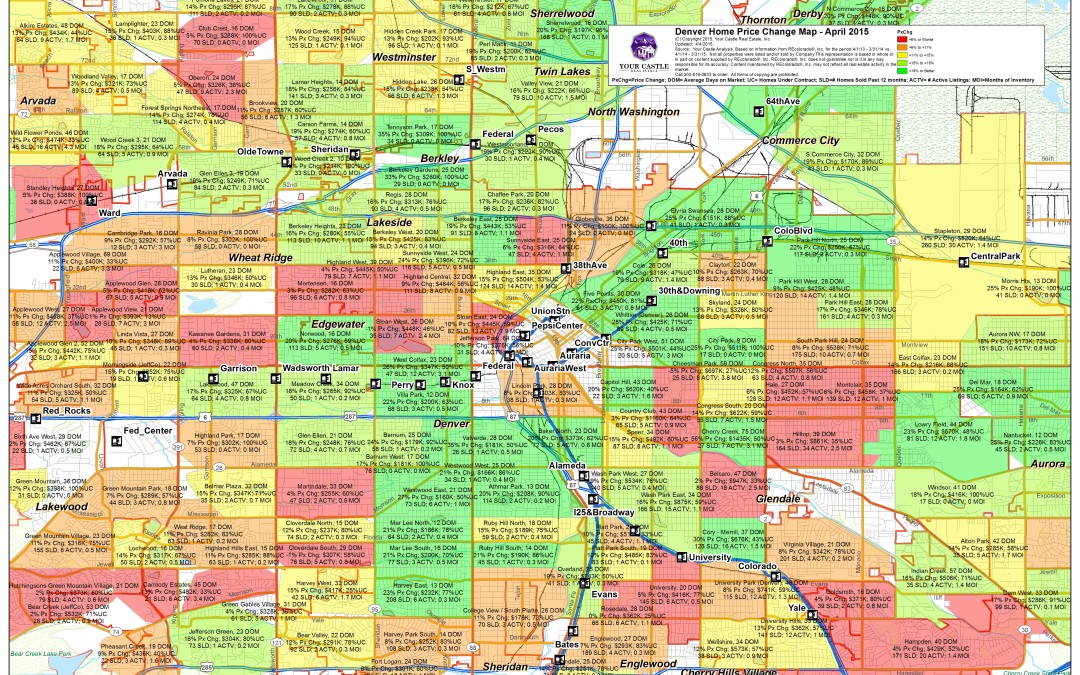
Denver Price Change Map – 1st Quarter
For more information on how to interpret this map and what I think the trends show for the future, just give me a call at 303-506-6786 or shoot me an email at aaron@inhabitdenver.com. Click on image to view at full size and zoom in to see specific neighborhood data. Key to Abbreviations: PX Chg=% Price Change, DOM=Days on Market, UC=Under Contract, SLD=Number Sold this Quarter, ACTV= Number of homes currently For Sale and not under contract, MOI=Number of Months of Current Inventory based on Current Sale Rates. ...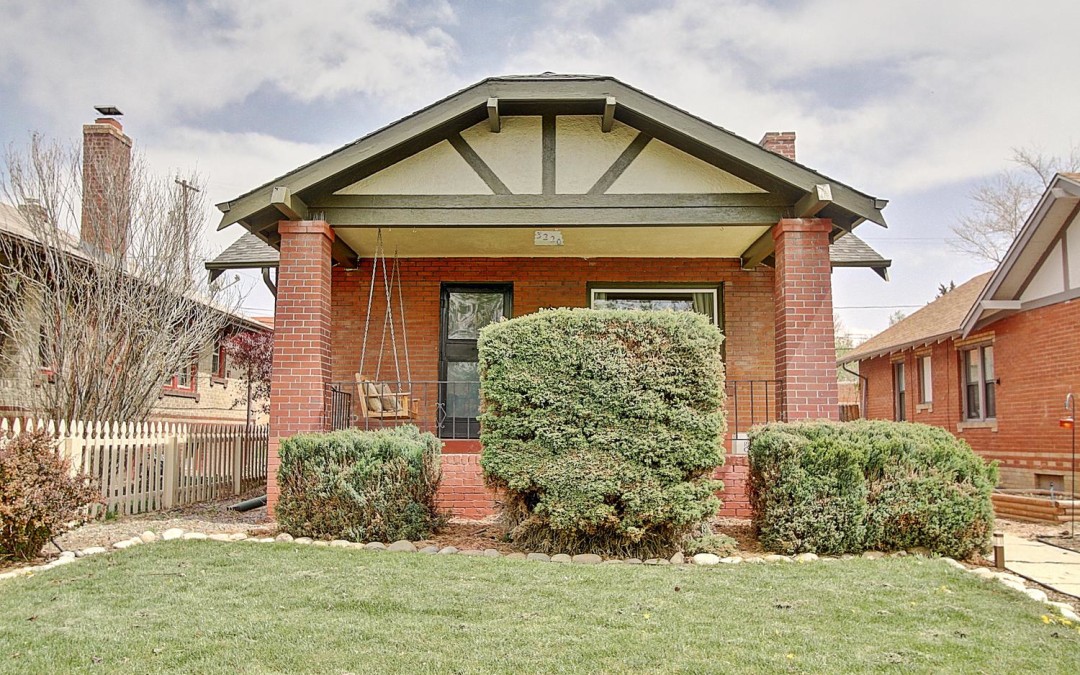
New Listing 3220 Madison Street. Charming Bungalow for 320K!
This is a good one. This 1926 Bungalow has all the charm of a Denver brick bungalow with the updates for how we live now. 2 stairs go down to the fully finished basement with new paint and brand new carpet. The main floor has wood floors throughout, new windows and a classically updated bath. Move in now or take it to the next level by adding a 2nd bath in the basement and a new 2 car garage. House is also getting a new sewer line so you are all set to add that garage without and issues with the city....
Bike Tour 2013
Inhabit Urban Homes is a full service Real Estate team that provides in-depth knowledge of Denver’s...